Introduction
neutrino is a GPU assembly probing tool providing
eBPF-like programming interface
for fine-grained, versatile, and programmable GPU kernel runtime profiling.
"Hello World" Example
Design with simplicity, Neutrino exposes a simple CLI and it's compatible with most frameworks like PyTorch and Triton.
Here is a simple Hello World of Neutrino using
FlashAttn-v2 implemented by Triton
as example workload:
# wget https://triton-lang.org/main/_downloads/54a35f6ec55f9746935b9566fb6bb1df/06-fused-attention.py
neutrino -p dmat python 06-fused-attention.py # can be any workload involving GPU
Then you can visualize the memory access pattern (DMAT Plot) of your GPU kernel:
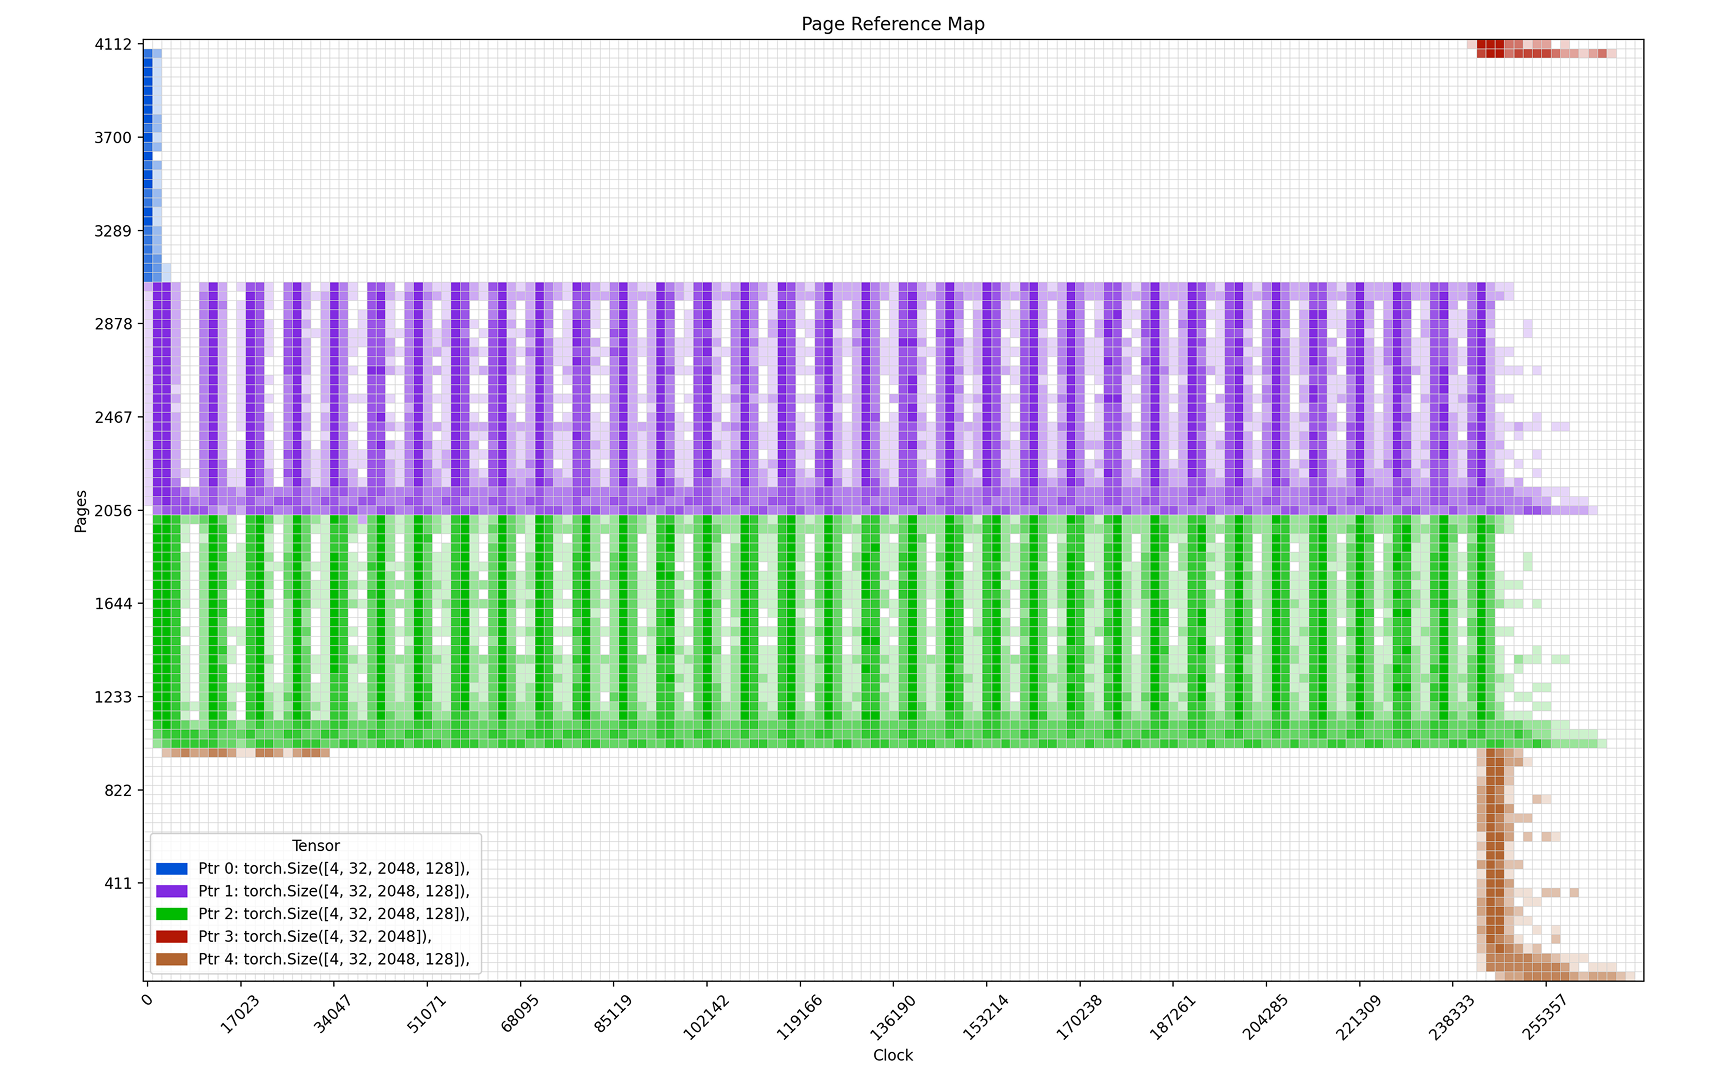
Beyond the memory visualization, Neutrino has several critical features:
Programmability
Neutrino defines a programmable interface than pre-built tools.
Users can easily build their own probes with our tracing language or handcrafting assemblies,
like the following source code behind -p dmat:
import neutrino
import neutrino.language as nl

CALLBACK = "dmat.py"

# declare shared registers across probes
start  : nl.u64 = 0 # starting clock
aligned: nl.u64 = 0

# define probes with @neutrino.probe decorator
@neutrino.probe(pos="kernel", level="thread")
def thread_start():
    start = nl.clock()

@neutrino.probe(pos="ld.global/st.global/cp.async.ca/cp.async.cg", size=16, count="dynamic")
def dmat():
    aligned = nl.clock() - start
    nl.save((aligned, nl.addr), dtype=nl.u32)
Moreover, Neutrino allows cooperative probes by leveraging registers as the temporal storage between probes. By doing so, NEUTRINO enables more complicated and more flexible profiling tasks by customizing and cooperating probes at different tracepoints and times.
Fine-Granularity
As demonstrated in the above source code, Neutrino directly works on instructions, the lowest software level, to offer the finest granularity of performance that can be effectively mapped to particular hardware units such as tensor cores and memory I/O unit.
Versatility
NEUTRINO profiles GPU kernel runtime from both the perspectives of value, i.e., capturing runtime values such as memory addresses and of time, i.e., recording event timestamps and advanced intra-kernel benchmarking by differencing timestamps. By spanning these two dimensions, NEUTRINO supports versatile profiling tasks, including memory access and GPU scheduling.
More Examples
We hosts more example on Colab for you to try!
Next Step
- Follow installation guide to setup Neutrino on your GPU-enabled machine.
- Check probing guide to write your first probe in DSL or assembly!
- Check more in DMAT Plot on how to inerpret this powerful visualization!
- Check our system design for more internal details!
- If you're interested, don't forget checking our roadmap to see what you can help making
Neutrinobetter!
Discussion Group
Coming Soon!